
Most business leaders in Chennai review their financial metrics every month without question. Revenue, gross margin, cash flow, outstanding receivables, these numbers are non-negotiable fixtures of the monthly management review.
HR metrics do not get the same treatment. They are reviewed occasionally, inconsistently, and often only when something has already gone wrong. By then, the metric is not a leading indicator. It is a post-mortem.
The best-run organizations in Chennai, across IT, manufacturing, BPO, and professional services, treat a core set of HR metrics with the same discipline they apply to financial metrics. Not because HR has convinced leadership that people matter, but because the data is genuinely predictive.
This article identifies the HR metrics that belong in every Chennai business leader’s monthly review, what each one measures, what it signals when it moves, and what action it should trigger.
In summary:
Monthly HR metrics reviews are not an HR department exercise. They are a business intelligence function. The metrics in this article predict cost overruns, compliance exposure, productivity gaps, and talent risk before they become visible in financial results. Business leaders who review them monthly make better decisions earlier.
Why Most Chennai Businesses Under-Use HR Data
Before identifying the metrics, it is worth understanding why so many Chennai businesses do not review HR data with the same rigor as financial data.
The four reasons HR metrics are under-used:
- The data is not ready: In organizations still running manual HR processes, producing a clean attrition report or an accurate overtime cost figure requires dedicated manual effort. This is a systems problem, not a leadership problem.
- The metrics are not connected to business outcomes: HR reports that show headcount, leave taken, and training hours in isolation do not compel attention. The same data framed as attrition cost, productivity impact, and compliance exposure does.
- There is no established cadence: Financial metrics are reviewed monthly because the review is scheduled, expected, and prepared for. HR metrics are reviewed only when someone remembers to ask.
- Action ownership is unclear: A metric that surfaces a problem but has no named owner and no defined response is a metric that generates discussion without generating change.
The 7 Categories of Monthly HR Metrics
1. Attrition and Retention Metrics
Why they belong in the monthly review: Attrition is the HR metric with the most direct and quantifiable financial impact. Every employee who leaves triggers replacement cost, productivity loss, and team instability.
The metrics to track:
- Monthly attrition rate
- Annualized attrition rate
- Early attrition rate
- Regretted vs. non-regretted attrition
- Department-level attrition
| Attrition Signal | Likely Cause | Leadership Action |
|---|---|---|
| Monthly rate rising for 3+ consecutive months | Compensation, culture, or management issue | Exit interview analysis; compensation benchmarking |
| Early attrition above 20% | Onboarding quality or role mismatch | Onboarding process review; hiring criteria audit |
| Regretted attrition above 30% of exits | Competitive offers or engagement deficit | Retention risk identification; compensation review |
| Single department above 25% annualized | Team-specific issue | Manager effectiveness review; workload assessment |
Chennai context: IT and BPO sectors in Chennai can see 25 to 40 percent annual attrition, while healthcare and professional services are often lower. Benchmarking by industry matters.
2. Absenteeism and Attendance Metrics
Why they belong in the monthly review: Absenteeism is a leading indicator of workforce health, engagement, and productivity. It also creates payroll and compliance risk if left unmanaged.
The metrics to track:
- Absenteeism rate
- Absence frequency
- Chronic absenteeism rate
- Department and shift-level absenteeism
- LOP incidence rate
Chennai context: Factory environments in Chennai’s industrial estates often see absenteeism rise around major festivals such as Pongal, Diwali, and Tamil New Year. Seasonal baselines matter.
3. Overtime and Labor Cost Metrics
Why they belong in the monthly review: Overtime is simultaneously a productivity signal, a cost driver, and a compliance risk. In manufacturing and BPO environments, it can silently create payroll overruns and statutory exposure.
The metrics to track:
- Overtime hours as a percentage of total hours worked
- Overtime cost as a percentage of total payroll
- Overtime by department and shift
- Repeat overtime employees
- Quarterly overtime accumulation for manufacturing teams
| Overtime Signal | Likely Cause | Leadership Action |
|---|---|---|
| Consistently above 10% of total hours | Structural understaffing | Headcount review; hiring plan acceleration |
| Concentrated in one shift or team | Workload imbalance or management pattern | Manager review; workload rebalancing |
| Rising month-on-month for a quarter | Demand growth outpacing capacity | Capacity planning review; project timeline review |
| Single employees at near-daily overtime | Skill gap or key-person dependency | Cross-training; succession planning |
4. Recruitment and Hiring Metrics
Why they belong in the monthly review: Hiring velocity and quality directly affect the business’s ability to deliver on growth plans.
The metrics to track:
- Time to fill
- Time to productivity
- Offer acceptance rate
- Quality of hire
- Cost per hire
Chennai context: Chennai’s IT talent market is highly competitive, and offer acceptance rates can fall quickly when candidates hold multiple offers. Monthly tracking matters.
5. Compliance and Statutory Metrics
Why they belong in the monthly review: Statutory compliance is not just an HR concern. It is a business risk with financial and reputational consequences.
The metrics to track:
- Statutory filing on-time rate
- ESI threshold compliance
- PF contribution accuracy rate
- Overtime compliance under the Factories Act
- Pending statutory document completions
A compliance metric that drops from 100 percent to 95 percent is not a minor admin issue. It is a signal that a once-stable process has broken down.
6. Payroll Accuracy and HR Operational Metrics
Why they belong in the monthly review: Payroll accuracy metrics tell leaders how well the HR function is operating and how reliable the employee experience of salary administration is.
The metrics to track:
- Payroll correction rate
- Payroll processing time
- HR query volume by category
- Onboarding completion rate
- Exit clearance completion rate
| Metric | Target | Action Threshold |
|---|---|---|
| Payroll correction rate | Below 1% | Above 3% – process review required |
| Payroll processing time | Under 3 days | Above 5 days – bottleneck investigation |
| HR query volume per 50 employees | Below 10 per week | Above 20 per week – self-service gap |
| Onboarding completion rate | Above 90% within 30 days | Below 80% – process review |
| Exit clearance completion rate | Above 95% within 30 days | Below 85% – process and accountability review |
7. Workforce Cost and Productivity Metrics
Why they belong in the monthly review: Workforce cost is usually one of the largest lines in the P and L. Revenue per employee and payroll as a percentage of revenue are business metrics, not just HR metrics.
The metrics to track:
- Revenue per employee
- Payroll cost as a percentage of revenue
- Cost per hire
- Overtime cost as a percentage of total payroll
- Leave liability
Chennai context: Leave liability can become significant in the Chennai IT sector, especially among senior employees with high accrued earned leave balances.
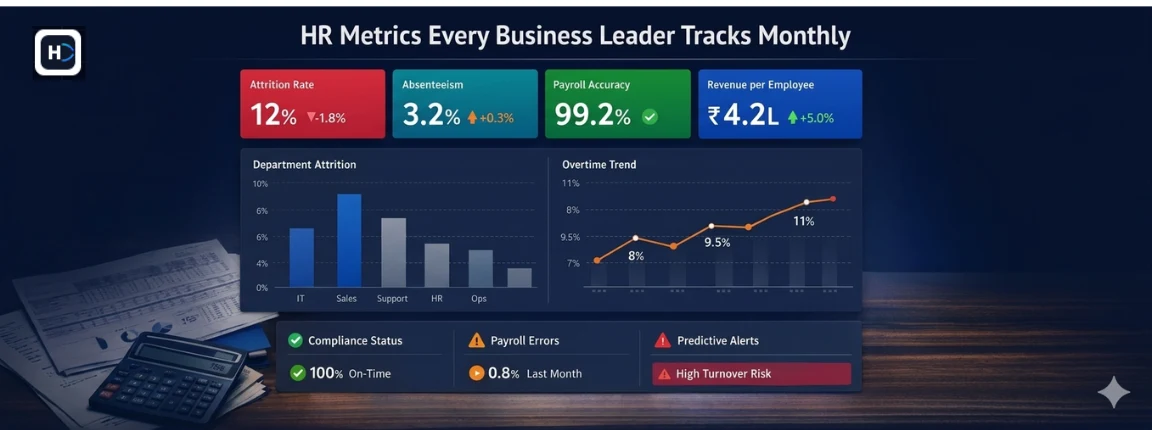
The Monthly HR Metrics Dashboard
The most effective format for leadership review is a single-page dashboard with one number per metric, a trend arrow, a red-amber-green status, and the owner responsible for any metric in amber or red.
| Category | Metric | This Month | Last Month | Trend | Status | Owner |
|---|---|---|---|---|---|---|
| Attrition | Monthly attrition rate | 2.10% | 1.80% | Up | Amber | CHRO |
| Attrition | Early attrition (0-90 days) | 8% | 12% | Down | Green | Talent Acquisition |
| Absenteeism | Unplanned absenteeism rate | 3.20% | 2.90% | Up | Amber | HR Operations |
| Overtime | OT as % of total hours | 7.40% | 6.10% | Up | Amber | Operations |
| Compliance | Statutory filing on-time rate | 100% | 100% | Flat | Green | Payroll |
| Payroll | Correction rate | 0.80% | 1.20% | Down | Green | Payroll |
| Productivity | Revenue per employee | Rs. 4.2L | Rs. 4.0L | Up | Green | Finance / HR |
| Cost | Payroll as % of revenue | 61% | 63% | Down | Green | Finance / HR |
The dashboard should be reviewed in no more than 20 minutes. Green metrics are noted and moved past. Amber and red metrics receive structured discussion: what changed, what is the root cause, and what is the specific action and timeline.
Putting It All Together: From Metrics to Action
Metrics without action thresholds are observation, not management. For each metric in the monthly review, define in advance:
- The baseline: what normal looks like for your business and sector
- The amber threshold: when the metric requires active monitoring and root-cause investigation
- The red threshold: when it requires immediate intervention with a named owner and deadline
- The owner: who is accountable for moving the metric back to green
This framework turns the monthly HR metrics review from a reporting exercise into a decision-making process.